Hyundai A League goals after 14 Rounds of the 2016-17 season
We are at the halfway stage of the season and I like to compare the scoring patterns with last season. I am more interested in goals scored in Open Play but record the goals scored from Set Plays because they are still very important. The total number of goals is up on last year from 193 to 207 with 142 and 160, respectively scored in Open Play.
2015-16 compared with 2016-17
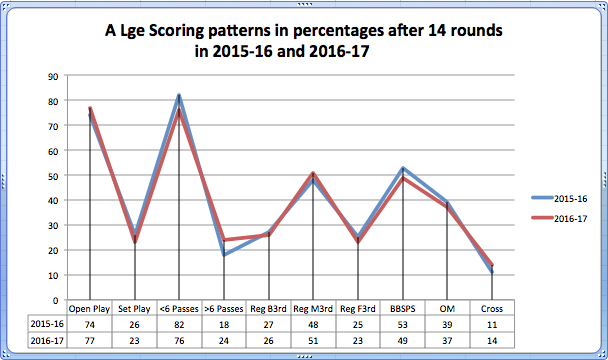
Figure 1 shows the comparison of all teams after 14 rounds. The graph shows the percentage scores and it is quite clear how similar the patterns are. The most noticeable difference is in the increase in the number of goals scored with 6 passes or more this season (24%) compared with last year (18%) or the decrease in the number of goals from 5 passes or less this year (76%) compared with last year (82%). In every other aspect of scoring the percentage change is between 1% and 4%.

Figure 1. A League scoring patterns after round 14 in 2015-16 and 2016-17
Goals from regained possession in each Third of the field
There is a consistent pattern of scoring the most goals from regained possession in the Middle Third of the field. Sydney (SYD) scored 50%, Melbourne Victory (MVT) scored 54% and the league average was 51%; Melbourne City (MCT) scored 40% but had a higher percentage from regained possessions in the Back Third (33%), which was the highest of the top three teams and above the league average (26%).
Goals in Open Play and from Set Plays
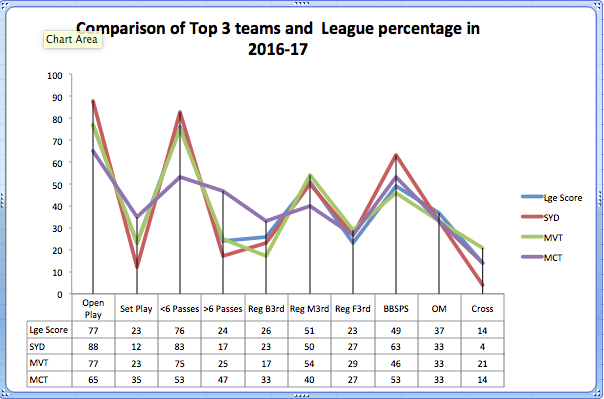
There are considerable differences in the scoring patterns of the top three teams and with the league average, shown in Figure 2. For example Sydney have the highest percentage of goals (88%) from Open Play, compared with the league average (77%) and Melbourne City (65%), which means Melbourne City (MCT) have the highest percentage from Set Plays, which is not a great indicator to win the league.

Figure 2. The scoring patterns of the top 3 teams and the league average in 2016-17
Goals from 5 passes or less and in each category.
Sydney have scored the highest percentage of goals (83%) with 5 passes or less and have the highest percentage of goals (63%) from playing the ball behind opponents or to a player level with the last defender (my research classification of BBSPS goals).
This indicates very quick transitions from defence to attack and quick forward movements by the players. Melbourne Victory (MVT) is close to the league average in both aspects but MCT (53%) are below the league average (76%) for scoring with 5 passes or less. Last season after 14 rounds they had scored 20 of their 28 goals (71%) from 5 passes or less, which is quite a difference. This would suggest fewer quick transitions from defence to attack, maybe passing the ball backwards rather than forwards at times, fewer forward runs and/or an emphasis on keeping possession. However, MCT (53%) is above the league average (49%) for goals from playing the ball behind opponents (BBSPS). At this stage last season MCT had scored 54% of their goals in the same category but with 7 more goals than this season, 15 compared with 8. MCT was the only team in the top three positions last season after 14 rounds.
There is consistency in scoring from the various categories; each team had the highest percentage from playing the ball behind the opposition (BBSPS), followed by any Other Methods (OM), which is essentially from in front of defenders followed by the lowest category of goals, Crosses.
Goals from regained possession in the Middle Third and each half of the field.
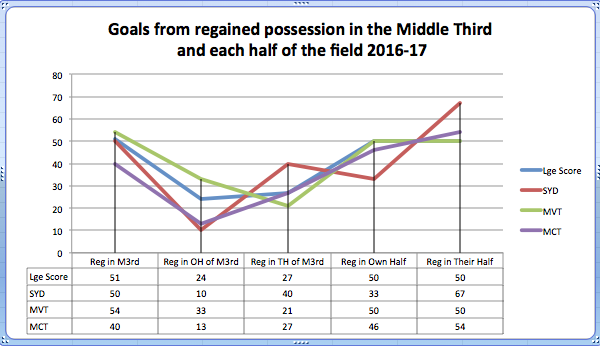
Figure 3 shows the breakdown of goals from regained possessions in the Middle Third of the field. Regains in the Middle Third usually account for most of the goals scored in Open Play and the results are consistent. However, there are considerable differences in which half of the Middle Third, teams regain the ball. SYD (10%) and MCT (13%) were well below the league average (24%), while MVT (33%) were above it. The figures demonstrate that there are differences between the teams in the areas where they tend to win back the ball, even when they are similar in that they all scored the most goals from regains in the Middle Third. SYD are the team that has scored the highest percentage of goals (40%) from inside the oppositions half of the Middle Third and (67%) from inside the opponents half of the whole field. MVT are similar to the league average with a 50-50 split in each half the field and MCT are the second highest (54%) behind Sydney.

Figure 3. Goals from regained possessions in the Middle Third of the field
What does the evidence mean to coaches?
The evidence from this data and from other seasons shows quite clearly that attacking quickly after regaining the ball, is a key factor in scoring goals. Unfortunately, many people think that adopting a possession-based style of football equates to long passing sequences and long periods of play with the ball, which can and does happen but results in fewer goals being scored.
Quick or Slow Attacks
When faced with a choice some teams will attack quickly more often and some will attack slowly more often because of the manager’s philosophy.
Figure 4 shows a quote from Jurgen Klopp, the Liverpool manager on his playing style.

Figure 4. Jurgen Klopp’s playing style
After seeing this I analysed the first half of two games involving Liverpool against Watford and Southampton in the English Premier League (EPL). At the time Liverpool had scored the most goals in the EPL. In the match against Watford, Liverpool had 75 possessions and they only made 6 or more passes on 15 occasions, which represents 20% of all their possessions; they had 15 attempts and scored 3 goals. Against Southampton they had 83 possessions and made 6 or more passes on 9 occasions, which is 11% of all their possession; they had four attempts and did not score. The fact is that if you want to play a fast attacking and pressing style of football, as Liverpool do, the style does not demand a lot of passes to be made before the players are close enough to take the risks to create scoring opportunities.
Conclusion
The evidence shows a high degree of consistency in a number of aspects of goal scoring across all the teams from season to season, but there are some differences between the teams at the top when compared with each other and the league average. This evidence is encouraging in my opinion because it shows there is not one way of doing anything in football and coaches have to be creative when it comes to getting the best out of the players they have at any given time during the season.