Analysis of Leicester’s goals in 2015-16
In my previous post I mentioned Leicester City FC because they bucked the trend by winning the English Premier League without dominating opponents with their percentage of possession. Most teams still win by having more possession than their opponents, so the critical issue is what the team does with the ball wherever it wins it.
Season 2015-16
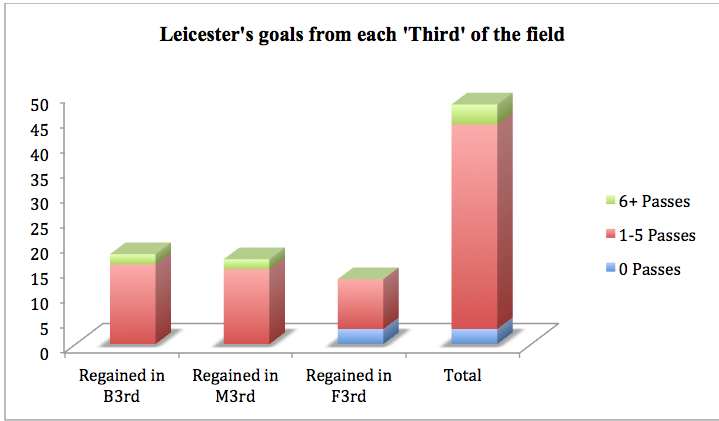
Leicester scored 48 goals in Open Play and 19 from Set Plays; 18 came from regained possession in the Back Third, 17 from the Middle Third and 13 from the Final Third. It is unusual for a team to score more goals from regained possessions in the Back Third compared with the Middle Third and is indicative of a team that defends deep in its own half as a priority. Similar results were seen in Euro 2016 where more goals were scored from regained possessions in the Back Third compared with the Middle Third, which was the first time that happened in the last four tournaments, reflecting a tendency for teams to defend deeper.
Leicester’s goals and the number of passes
Overall Leicester scored 44 of the 48 goals with five passes or less, which is 92% of all goals in Open Play. Of the 18 goals from regained possessions in the Back Third 16 were scored with 5 passes or less; 12 were scored with 3 passes or less, 3 from 4 passes, 1 from 5 passes and 2 from six passes or more. See Figure 1.

Figure 1 Goals from regained possession in each ‘Third’ and the number of passes
The evidence shows that Leicester were very quick to attack from deep positions when the opportunity presented itself, which should not be taken for granted as many teams do the opposite and play slowly from deep positions. Further analysis of the 18 goals showed that 3 came after a long kick by the goalkeeper, 5 from a long pass by an outfield player and 10 came from passing or running with the ball from the Back Third.
Time in possession from the Back Third
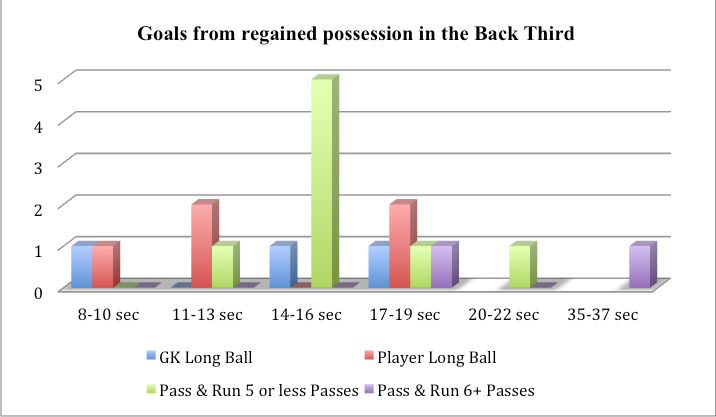
The average time in possession for the 3 goals from the goalkeeper kicking the ball long was 13 seconds (range 8 to 17 seconds). The average time for the 5 goals from an outfield player passing the ball long was 13 seconds (range 9 to 17 seconds) and the average time in possession for the 8 goals when the ball was passed quickly and or a player ran with the ball was 15 seconds (range 11 to 20 seconds). The time in possession for the 2 goals from regained possession in the Back Third when six or more passes were made was 37 seconds and 17 seconds. See Figure 2.

Figure 2 Time taken to score in different categories
Figure 2 shows that there was no consistency in the time taken to score from long forward passes, either from the goalkeeper or by an outfield player with goals between 8-10 seconds and 17-19 seconds in both categories. The only category that had any consistency for the time taken was the passing and running with the ball where 5 goals were scored between 14-16 seconds. The average time for the 16 goals from 5 or less passes was 14 seconds (range 8 to 20 seconds). The two goals when Leicester made six or more passes took 17 seconds (6-9 passes) and 37 seconds (10-15 passes).
Time in possession from the Middle Third
Leicester scored 17 goals from regained possession in the Middle Third, 15 of which were from 5 passes or less. The average time to score was 13 seconds. However if the goals are separated into Own Half and Their Half of midfield, the average for 8 goals in their Own Half was 15 seconds (range 8 to 23 seconds) and 11 seconds for the 7 goals from Their Half of midfield (range 5 to 16 seconds).
Time in possession from the Final Third
Leicester scored 13 goals from regained possession in the Final Third from 5 passes or less with an average of 7 seconds (range 2 to 17 seconds); 8 goals were scored between 4 to 6 seconds.
Implications for coaches
The speed of transition is a critical element in scoring goals regardless of where possession is regained. The average time for goals from the Back Third and Middle Third was 14 and 13 seconds respectively. In other words, teams had 14 seconds to recover after losing the ball in Leicester’s Back Third. Most players could run more than 70 metres in less than 14 seconds so why did Leicester score so quickly and so often from their Back Third? The evidence suggests players were not sufficiently organized to defend their goal when possession is lost. That may be a result of losing concentration, or a slow reaction time to respond to losing possession and / or inability to defend against opposing players who were in dangerous positions. All coaches can rationalize why they conceded goals. In a concise way it means teams have to be better organized to defend whenever and wherever they lose the ball.
Vulnerability to concede goals
Teams are most vulnerable to concede goals when they are attacking so players who are not immediately involved in the attack should rethink where they ought to be at any given moment to be able to support the attack if needed and where they could defend quickly if possession is lost, particularly in the Final Third and the Middle Third of the field. This applies to when the team is trying to pass the ball to each other and other situations such as when the goalkeeper takes a goal kick or makes a long forward pass. Obviously it is harder to do when possession is lost in a team’s Back Third because the average time for Leicester’s goals when possession was regained in the Final Third was 7 seconds.
In recent years I have been introduced to Qualitative Analytics through Sports Wizard®, the leading company in the world. I have learned when and why a team is most ‘Vulnerable’ and that it has to be protected through practice. The first step in applying Qualitative Analytics is to recognize vulnerability exists and then to do something about it in a practical way rather than just talking about it or accepting it as part of the game. The speed at which Leicester scored goals from inside its own half was a result of its ability to transition from defending to attacking very quickly and by opposing teams not sufficiently protecting their vulnerability to concede. Protecting vulnerability is just one aspect of performance when viewed from a qualitative perspective. Information on Applied Qualitative Analytics is available on – www.sportswizard.com
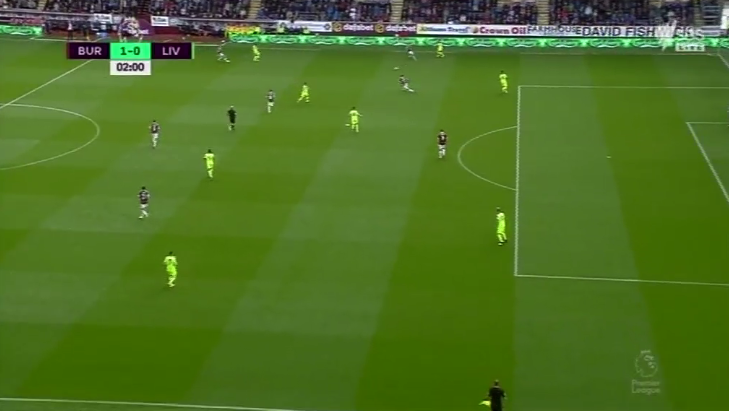
The first goal that Liverpool conceded against Burnley in the English Premier League this weekend was a classic example of not protecting vulnerability. The picture shows the position of Liverpool’s central defenders and left back as the ball was about to be won by the Burnley player before passing to his fellow striker on the edge of the penalty area. Teams that want to play high risk football in their Back Third need to think seriously about protecting their vulnerability.


The position of Liverpool’s central defenders and left back moments before conceding a goal against Burnley.